
February 13, 2023
. 1 min readReact Developer Tools: Debug and optimize React apps
This tutorial will introduce you to the React developer tools and get started with analyzing a React application for performance optimization.

To debug and inspect component hierarchies, we use the React Developer Tools (also called React DevTools).
This tool lets us keep track of the component’s state, props, hooks, etc., and analyze a React application for performance optimization.
This React tutorial is part 6 of 17 in the React for beginners series.
- Part 1 – React Tutorial: A Comprehensive Guide for Beginners
- Part 2 – React Components and Data Model
- Part 3 – React Hooks: Managing State and Side-Effects
- Part 4 – Build React Form With This Best Practice
- Part 5 – Raising and Handling Events in React
- Part 7 – CSS in React: Styling React Components
- Part 8 – React Todos App: Add Editing functionality
- Part 9 – Profiling: Optimizing Performance in React
- Part 10 – Using LocalStorage with React
- Part 11 – How to Use React Icons
- Part 12 – React Context API: Managing Application State
- Part 13 – Zustand Tutorial: Managing React State
- Part 14 – React Router: The Beginners Guide
- Part 15 – React children props: What Is It?
- Part 16 – React Toggle Button: Let’s Switch Navigation Widget
- Part 17 – Deploy React App With Vercel
To use this tool in our application, we'll install it as a browser add-on:
Install React Developer Tools
Head over to the extension page for your browser of choice and install it:
After installation, that is all. It does not require any other setup.
Note: This lesson uses Chrome React DevTools for demos and screenshots
Detecting a React Application
With the React DevTools installed, we’ll know at a glance if a webpage is rendering a React web application. For React apps in production, a blue React icon will appear at the upper right corner of the browser:
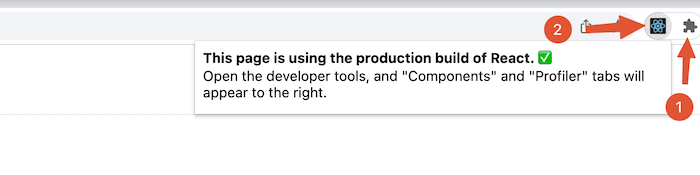
If you cannot find the icon, click on the Extensions icon, label 1, and click on the pin icon by the React Developer Tools.
For React apps in development, the icon will appear in red:
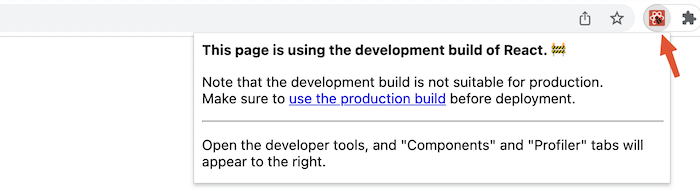
Otherwise, the webpage does not render a React web application, and the icon will appear grey.
React Profiler and Components Tabs
These two tabs will appear after we install the DevTools while React project is running. See label one(1) below:
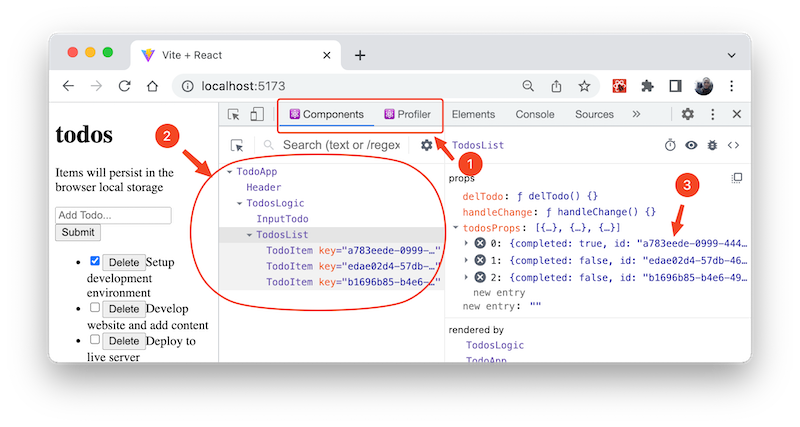
The Components Tab
On the Components tab, we can view the app’s components hierarchy, as seen in label 2, and the props and state of the application, as seen in label 3. If we interact with our application and update the state, we will see the changes in real time in this tab.
Try exploring the tools by navigating through different tree components and viewing the state and props data.
The React Profiler Tab
On this tab, we can measure the performance of a React application. The Profiler allows us to record the time it takes a component to render. It also lets us see why it renders so we know where bottlenecks are within an application.
Understanding how to measure an application’s performance using the Profiler is vital to implement necessary optimization. We’ll later explore this tool in this series.
You can also learn more in this article: How to optimize React app’s performance.
This is a quick lesson! Up next, we will discuss how to style a React application.
Next part: CSS in React: Styling React Component
continue